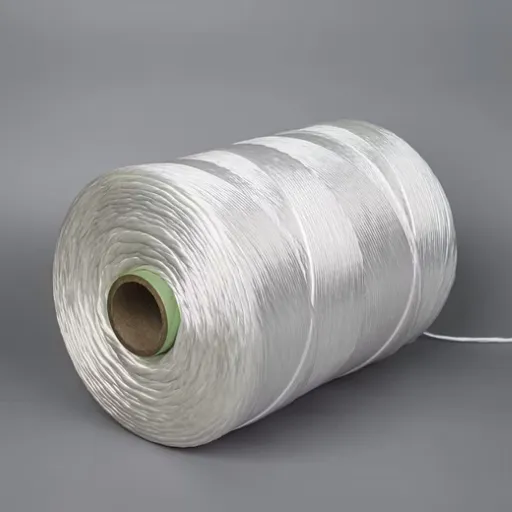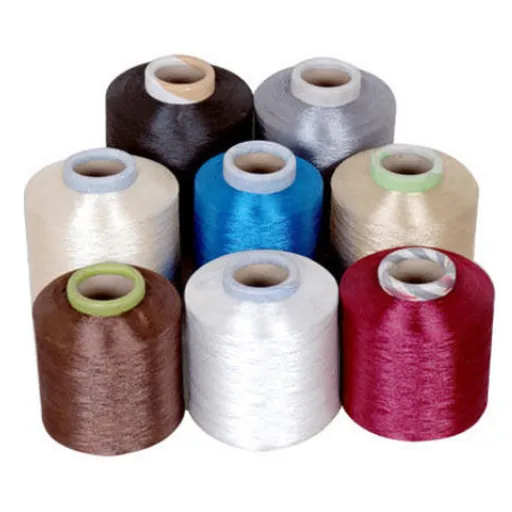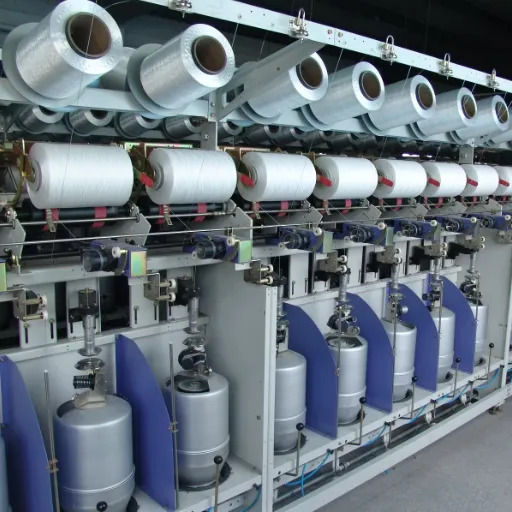
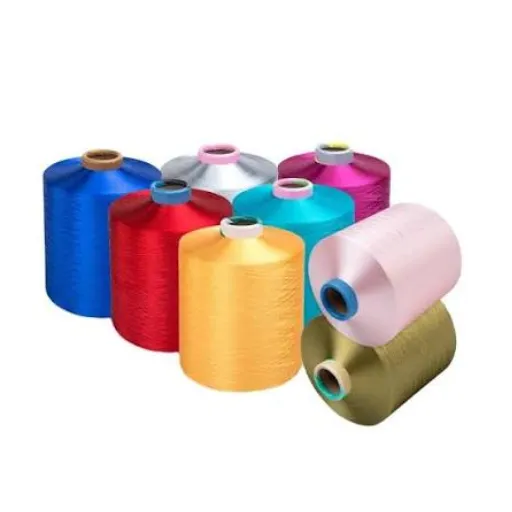





China’s benchmark 1000D/192F high-tenacity industrial polyester yarn was quoted at about RMB 12,200 per tonne ex-works on 11 November 2026. That is roughly 40% above the late-January low of RMB 8,700 to 8,800, but the path was not straight. The same grade traded at RMB 12,800 on 3 to 4 November and RMB 11,900 on 6 November, a RMB 900 round trip in eight days.
This guide explains the 2026 industrial polyester yarn price trend in China: the dated numbers, the cost chain behind them, the grade split, and how to time a purchase. Our includes the industrial filament used in these applications.
Key Takeaways
- China’s 1000D/192F high-tenacity industrial polyester yarn was quoted at RMB 12,200/t on 11 November 2026, after RMB 12,800/t on 3 to 4 November and RMB 11,900/t on 6 November.
- The 2026 price trend is up about 40% from late January, driven by crude oil, PTA, MEG and PET chip costs, not by a domestic demand boom.
- China’s industrial yarn capacity is about 3.27 million tonnes a year, and conventional high-tenacity grades have had no new capacity for three years.
- Low-shrinkage yarn carries a RMB 300 to 600/t premium over high-tenacity. HMLS now sells at only about RMB 500/t over high-tenacity, so its margin is near breakeven.
- The base case for 2027 is high-level, range-bound trade, not a return to the 2026 low. Watch Brent, the PTA/MEG basket and the chip-to-yarn spread.
What the China Industrial Polyester Yarn Price Benchmark Measures
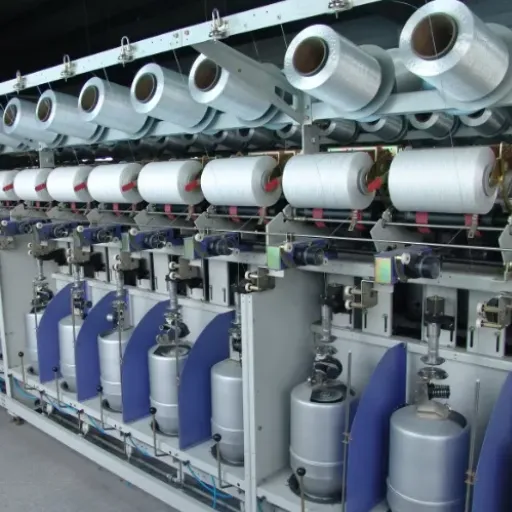
The number buyers usually mean is the ordinary high-tenacity 1000D/192F quote, cash ex-works, in East China. It is the most widely quoted industrial grade, used in webbing, rope, conveyor belt, hose, geotextile and sewing thread.
It is not the only price. Three distinctions change the number by hundreds of yuan per tonne.
A quote is not a transaction. On 3 to 4 November, several mills quoted RMB 12,800/t. On 6 November, plants ran a one-day promotion and the market moved to RMB 11,900/t. By 11 November, the quote was back at RMB 12,200/t.
None of those moves reflected a change in the polymer or the machine. They reflected how badly mills wanted orders that week.
Terms matter. A cash ex-works quote and a three-month acceptance delivered quote are not comparable. Low-shrinkage yarn on acceptance terms often carries a RMB 300 to 600/t premium over high-tenacity cash. Comparing the two headline numbers measures two different things.
Domestic and export prices are separate markets. In 2024, China’s average export price was USD 1,389/t, down 6.5% year on year, while the average import price was USD 2,633/t, down 4.2%, according to . China ships commodity yarn out and imports higher-specification grades, so a domestic RMB quote and an FOB China quote can move at different speeds.
For denier, filament count and tenacity definitions, see our .
Need a number for a specific construction? Send the grade, denier, filament count, quantity and delivery terms, and our team will confirm how the quote is built. .
The 2026 Industrial Polyester Yarn Price Trend, Month by Month
The table uses the 1000D/192F high-tenacity quote unless another grade is stated. All figures are RMB per tonne.
| Date | High-tenacity 1000D/192F | Low-shrinkage 1000D | HMLS | What happened |
|---|---|---|---|---|
| Late January | 8,700 to 8,800 | n/a | n/a | Pre-Spring Festival low |
| Early March | 9,100 to 9,200 | n/a | n/a | Concentrated low-price transactions |
| March average | 11,627 | n/a | n/a | Chip 7,394; spread 4,233 |
| 15 April | 11,900 | 12,500 | n/a | One-day promotion, down 400 |
| 11 June | 11,100 | n/a | n/a | Down 1,100 from early May; spread 3,650 |
| 8 July | 10,500 | 10,800 | n/a | One-day promotion; export USD 1,450/t FOB |
| 3 to 4 November | 12,800 | 13,100 | n/a | Mill quotes at the 2026 high |
| 6 November | 11,900 | 12,200 | n/a | One-day promotion |
| 11 November | 12,200 | 12,500 | 12,700 | Recovery; HMLS quote from Shandong Bolite |
Sources: CCFGroup for January to July, Mysteel and Longzhong mill surveys for November. The November HMLS figure is a single mill quote, not a market average.
The pattern is a January low, a March to April spike of about 27% as crude and chip costs rose, a June to July correction to 10,500, an August to October recovery to 12,800, and a November round trip. In November, mills tried to hold 12,800, a one-day promotion on 6 November cut the market to 11,900, and the quote recovered to 12,200 by 11 November.
The March average confuses buyers most. Early March transactions happened at 9,100 to 9,200, but the March average was 11,627. Both are correct. The low-price window was short and concentrated; most of the month’s volume traded after mills raised offers. A monthly average can hide a 27% intra-month move.
Why the Industrial Polyester Yarn Price Trend Changed

The 2026 industrial polyester yarn price trend was cost-led. Demand was weak for most of the year. Prices rose because the feedstock basket rose, and because Chinese mills cut output to protect margin instead of chasing volume.
The cost chain from Brent to PET chip
The chain runs from crude oil to PX, PTA and MEG, then PET chip, then yarn. Each step lags the one before it, which is why yarn prices can keep rising after crude has turned.
On 12 November 2026, the inputs were:
- Brent: USD 95.82/bbl, up 3.30% on the day and about 57% higher year to date. It was still 19% below the 52-week high of USD 118.35 set on 31 March 2026.
- PTA: RMB 6,515/t, up 1.30% on the day.
- MEG: RMB 5,980/t, up 5.35% on the day.
- PET chip: RMB 7,845/t, down 0.32% on the day.
Source: . The report uses 12 November closing data.
A common industry shortcut weights the two feedstocks at 0.86 PTA and 0.35 MEG. Applied to the 12 November spots, the basket is 0.86 x 6,515 + 0.35 x 5,980 = RMB 7,695.9/t. Chip was RMB 7,845/t, about RMB 149/t higher for conversion. If a supplier’s chip basis is far from this basket, ask what is included.
The processing spread tells you how much room mills have
The processing spread is the yarn price minus the chip price. At RMB 12,200/t yarn and RMB 7,845/t chip, the spread is about RMB 4,355/t. That is wider than the RMB 4,233/t March average and much wider than the RMB 3,650/t spread in June.
A wide spread means mills can discount without immediately losing cash, so a 12,800 quote is not necessarily the floor. It is also why the 6 November promotion happened: mills cut because the spread was wide enough to buy orders, not because costs fell.
Supply discipline: three years without new high-tenacity capacity
China’s polyester industrial yarn capacity was 3.288 million tonnes a year in 2025. Between 2021 and 2025, the industry added only 690,000 tonnes, a 2.59% cumulative increase and a compound annual growth rate of 0.64%, according to Longzhong’s annual report preview.
For 2026, capacity was adjusted to 3.268 million tonnes after removing a 50,000-tonne line and adding a 30,000-tonne HMLS line. Planned additions of 130,000 tonnes would take capacity to 3.398 million tonnes. Most of that is HMLS, not conventional high-tenacity.
The operating rate tells the same story. It was 66.63% on 21 October 2026, a low level by historical standards, as mills cut output to support prices. Industrial yarn is a concentrated market; textile polyester is fragmented and oversupplied.
Demand: weak at home, exports carrying volume
Domestic demand was weak through most of 2026. CCF described downstream buying as need-based, with little speculative restocking. SunSirs described the polyester yarn market as “both supply and demand weak,” with off-season orders that were small and short-term.
The textile chain confirms it. On 12 November, 32S ring-spun polyester yarn in Shandong was RMB 12,815/t, down RMB 100/t week on week. Polyester staple fibre had fallen to RMB 8,540/t from about RMB 9,045/t in October. The polyester DTY benchmark was RMB 10,349.17/t on 12 November, down 2.44% from the start of the month. POY 150D was around RMB 8,800/t, nearly RMB 1,000/t below its October high.
Industrial yarn held up better because its demand mix is different. It goes into tire cord, seat belts and airbags, conveyor belts, hose, geotextiles, rope, tarpaulin and industrial sewing thread. Those markets are driven by infrastructure, freight, automotive production and replacement cycles, not apparel seasons.
Exports are the other support. In the first half of 2025, China exported 680,000 tonnes of polyester industrial yarn, up 14.2% year on year, equal to 57.6% of output, according to . When domestic demand is slow, export orders decide how much pressure mills put on price.
Sourcing industrial yarn for a technical application? Our covers specification, sampling and order terms. If you already know the spec, for a quote.
Supply, Demand, and the Grade Split
“Industrial polyester yarn” is not one product. Three grades dominate the China polyester yarn market, and their prices have diverged in 2026.
| Grade | What it is | Typical use | 11 November quote | Premium over high-tenacity |
|---|---|---|---|---|
| High-tenacity (HT) | Standard industrial polyester, high strength | Rope, webbing, conveyor belt, hose, geotextile, sewing thread | RMB 12,200/t | n/a |
| Low-shrinkage | Heat-set for lower shrinkage | Seat belt, geotextile, coated fabric, narrow fabric | RMB 12,500/t | RMB 300/t, range 300 to 600 |
| HMLS | High-modulus low-shrinkage | Tire cord and carcass fabric | RMB 12,700/t | About RMB 500/t |
| 3000D high-tenacity | Coarser high-tenacity | Heavy webbing, sling, rope | RMB 11,900/t on 6 November | Same as 1000D in that quote |
Sources: Mysteel/Longzhong mill surveys, 11 November 2026; CCFGroup grade analysis, 7 September 2026.
Low-shrinkage yarn is heat-set to reduce shrinkage under heat. It is not automatically better than high-tenacity. It is better when the end product is exposed to heat during coating, calendering or vulcanization, or when dimensional stability matters in a seat belt or geotextile.
The premium is RMB 300 to 600/t. On a 100-tonne order, that is RMB 30,000 to 60,000. Pay it only if the process or the specification needs it.
HMLS is the grade used in tire cord. It costs RMB 500 to 1,000/t more to make than conventional high-tenacity, because it needs higher modulus and tighter shrinkage control. In 2026, it sold at only about RMB 500/t over high-tenacity, and only about RMB 200/t over low-shrinkage. The margin is near breakeven.
The reason is new capacity. Junma added 40,000 tonnes in 2024 and 20,000 in the first half of 2026, Taiji 6,000 in 2025, Polytex 25,000 in the first half of 2026. Haiyang Technology is phasing in 80,000 tonnes in the second half, and Guxiandao is restarting idled capacity.
All of it is HMLS. The HMLS market has moved from supply-short to supply-surplus, and tire-cord producers now make more of it themselves.
For a strength-first explanation of tenacity, elongation and shrinkage, see our .
China produced 2.207 million tonnes of polyester industrial yarn in 2024, up 8.1% year on year. If more than half of output is exported, China’s domestic price is not set by Chinese demand alone. It is set by the cost of Chinese exports versus Indian, Vietnamese, Korean and Turkish supply, and by freight and trade policy.
What the Industrial Polyester Yarn Price Trend Means for Buyers
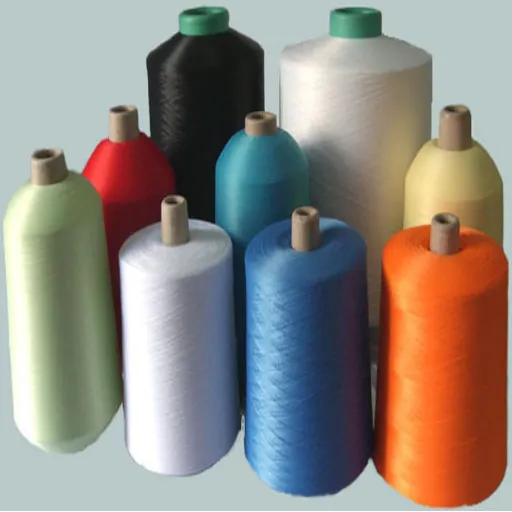
The practical question is not “will the price go up or down?” It is “what should I do with this order, at this specification, on these terms, this month?”
How to time a purchase
Start with the spread, not the headline price. At RMB 12,200/t yarn and RMB 7,845/t chip, the spread is about RMB 4,355/t. That is wide enough for mills to discount if they need volume. If your order is not urgent, waiting for a promotion is reasonable. If it is urgent, locking at a wide spread is safer than locking after a cost spike.
Consider a 100-tonne order. At the 3 to 4 November quote of 12,800, the yarn cost is RMB 1.28 million. At the 6 November promotion price of 11,900, it is RMB 1.19 million. The difference is RMB 90,000 on one order. That is the value of watching the quote for a week, not a year.
How to read a quote
Ask for six things before you compare suppliers:
- Grade and spec. High-tenacity, low-shrinkage or HMLS; denier and filament count; tenacity, elongation and shrinkage.
- Price basis. Cash ex-works, acceptance delivered, or FOB. Include VAT and freight.
- Quantity. The price for 20 tonnes is not the price for 200 tonnes.
- Quote validity. Chinese mill quotes can change daily. A quote without a validity date is a conversation, not an offer.
- Chip basis. Ask what PET chip price the quote assumes. If the supplier cannot answer, the quote is not index-linked.
- Lead time and packing. Delivery time, pallet or carton, and container loading.
What to watch in 2027
The cost outlook points lower. The EIA’s November 2026 Short-Term Energy Outlook sees Brent averaging USD 97.44/bbl in 2026 and USD 85.78/bbl in 2027, falling to USD 77/bbl by the fourth quarter of 2027. Lower crude would ease PTA, MEG and chip costs, and eventually yarn.
The supply outlook points higher on the floor. China added only 690,000 tonnes of industrial yarn capacity in five years, and no new conventional high-tenacity capacity in three years. Even with 130,000 tonnes of planned additions, most of it is HMLS. High-tenacity and low-shrinkage are not heading into a capacity flood.
The demand outlook is the swing factor. Domestic textile demand is weak. Export orders are the offset. If export orders hold and crude falls, prices drift lower in a range. If crude spikes again, as it did in March and November, prices can jump regardless of demand.
Base case: high-level, range-bound trade. High-tenacity holds roughly RMB 11,000 to 12,800 through the first half of 2027, with the cost floor falling and the supply floor holding.
Bull case: Brent moves back above USD 100, restocking resumes, and high-tenacity tests RMB 12,800 to 13,100 again.
Bear case: Brent falls below USD 85, export orders slow, and high-tenacity returns to RMB 10,500 to 11,000, the zone where the July 2026 promotion traded.
These are scenarios, not forecasts. The triggers are observable: Brent, PTA, chip, the spread, and export order books.
Comparing high-tenacity and low-shrinkage for a technical textile? Our shows which grade fits which end use. For a quote on a specific construction, .
Frequently Asked Questions
What is the current price of industrial polyester yarn in China?
The benchmark 1000D/192F high-tenacity grade was quoted at about RMB 12,200/t ex-works on 11 November 2026. Low-shrinkage 1000D was about RMB 12,500/t, and HMLS was about RMB 12,700/t. Prices are indicative and change with chip costs and order terms.
Why did industrial polyester yarn prices rise in 2026?
Crude oil, PTA and MEG costs rose, and PET chip followed. Brent was up about 57% year to date by 12 November 2026. Chinese mills also cut output to protect price, and high-tenacity capacity had not grown for three years. Weak domestic demand limited the pass-through but did not reverse the cost push.
Will industrial polyester yarn prices fall in 2027?
The cost side points lower: the EIA sees Brent averaging USD 85.78/bbl in 2027, down from USD 97.44 in 2026. The supply side points to a higher floor, because China has added little conventional high-tenacity capacity. The base case is a high-level range, not a return to the 2026 low.
What is the difference between high-tenacity and low-shrinkage industrial yarn?
High-tenacity yarn is optimized for strength. Low-shrinkage yarn is heat-set to reduce shrinkage under heat, which matters in seat belts, geotextiles and coated fabrics. Low-shrinkage typically costs RMB 300 to 600/t more. Specify it only when the process or the end product needs dimensional stability.
How is industrial polyester yarn priced?
Most Chinese quotes are built from a PET chip price plus a processing spread. The spread covers conversion, energy, labor and margin. A common feedstock shortcut is 0.86 x PTA plus 0.35 x MEG, which gave about RMB 7,696/t on 12 November against a chip price of RMB 7,845/t.
Is the China domestic price the same as the export price?
No. Domestic quotes are usually cash ex-works in RMB. Export quotes are FOB China in USD and reflect different grades, volumes and terms. In 2024, China’s average export price was USD 1,389/t and its average import price was USD 2,633/t, a sign that the trade is not one uniform product.
The Bottom Line
China’s industrial polyester yarn price is high relative to its own history, but it is not in a demand-led boom. The 2026 industrial polyester yarn price trend is a cost push, amplified by supply discipline and a grade mix that is shifting toward HMLS. High-tenacity and low-shrinkage have a supply floor. HMLS does not.
For buyers, the useful number is not the headline quote. It is the quote plus the terms, the grade and the date. A RMB 900/t move in eight days is normal in this market. A quote that does not state its basis is not a price you can plan around.
If you are sourcing industrial polyester yarn for webbing, rope, conveyor belt, hose, geotextile, tire cord or sewing thread, send the specification, quantity and delivery terms. We will tell you what is available, how the quote is built, and what to watch before you commit. and put the grade, denier, filament count and terms in the first message.
Data sources
Prices and market data were checked on 13 November 2026 against CCFGroup (20 April, 11 June and 7 September 2026), Mysteel/Longzhong (11 November 2026), OilChem/Longzhong (13 November 2026), SunSirs (13 November 2026), IndexBox (updated 23 March 2026), the EIA Short-Term Energy Outlook via Oil & Gas Journal (10 November 2026) and 21jingji (29 September 2025). RMB figures are per metric tonne unless stated. Prices are indicative and change daily.